The main point of KnowledgeSmart is to provide AEC firms with detailed skills gap and training needs analysis data. So let's take a proper look at the process.
To begin, we will assume that you have already gone through the process of adding users, inviting users, assessing your teams and you now have a healthy selection of results in your KS dashboard.
Don't forget, you control the amount of feedback that users get to see at the end of their test session, by selecting your preferred option on the Settings > Test Feedback page.
And you can also choose to display (or hide) the 'Skip Question' (I don't know the answer) button, the 'Request Training' (I'm not sure about my answer) button and the test logout button, via the Settings > Test UI Options page. This will have an impact on the types of results data you are able to capture and analyse later on.
Last, you can choose to display (or hide) the user data capture pages, which appear at the start and end of a test session. We will be adding some new search values shortly, which allow you to create reports on user profiles and demographic data.
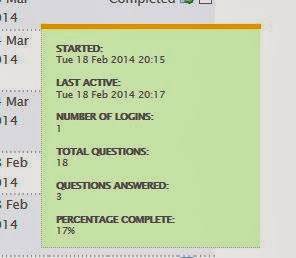
You can monitor the status of your invites (Not started, In Progress, or Completed) on the Invites > History page.
For the purposes of this exercise, we're using dummy results data, to protect the (incompetent?) innocent!
When you teams have completed their assessments, you can view your KS results in the Results > Data area of your dashboard.
Use the 'Results per page' drop-down to change the number of results displayed on screen.
Use the account drop-down menu to view results data across linked accounts.
Click on the score link to view a detailed summary of each test report. The report opens up in a new window.
You can display links to in-house or third party learning resources in the test report, which builds a bridge between the testing and training parts of your learning journey.
Creating GroupsYou have a range of searching & grouping tools available, for filtering and analysing your KS results in detail.
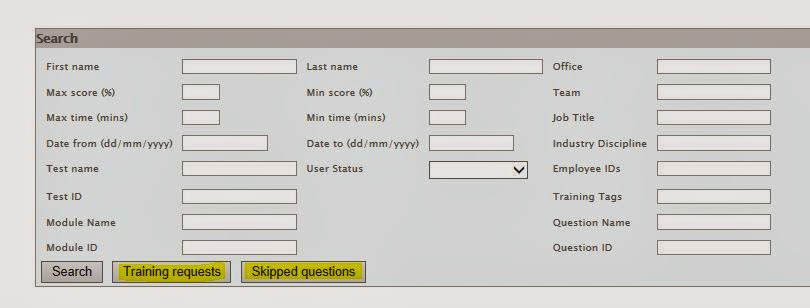
Step oneSelect the 'Show search' link in the orange bar, at the top of the Results page.
There are a variety of different search parameters. You'll also see the five user datafields on the right hand side of the search box (you can add your own custom labels on the Settings > User Datafields page). Use these values to add more depth to your results searching & filtering options.
Step twoEnter the information in the relevant search field and hit 'Search' to filter your results data. Use the check boxes to select your results records for the new group.
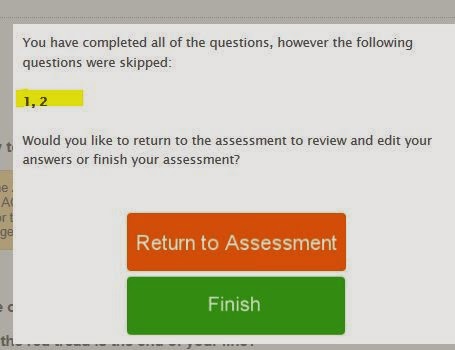
Selecting the 'Training requests' filter will display a list of all users who have selected the 'Request training' button during their test session.
Click on each report to see which questions have been flagged.
Step threeSelect the 'Show groups' link in the orange bar.
Step fourUse the 'Create New Group' tool to create a new sub-group of your results, based on the output of your search. Once you have selected your results, type in the name of the new group and hit 'Create'.
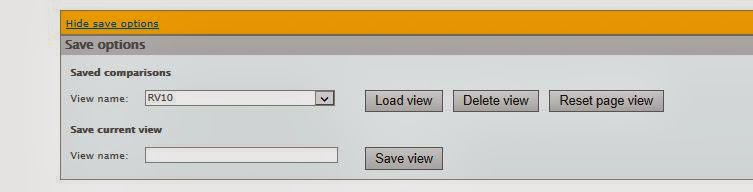
Step fiveUse the 'View group' drop-down menu to navigate between sub-groups of your results data.
Dynamic Groups
Use the dynamic grouping tool to create new groups which will automatically update, when new test results are added to your dashboard.
Step oneSelect the 'Show dynamic groups' link in the orange bar.
Step twoUse the 'New Group' tool to create a new dynamic grouping of your results. Enter the group name in the field provided.
Step threeUse the 5 datafield drop-downs to create the rules you require, for adding existing and future results to your group. Save your new dynamic group, by selecting Save Group.
For example, a results group has been created based on datafield 1, City: London. The next time a new result is added to the database and the associated user record includes datafield 1, City: London, then the results record will automatically be added to the existing group.
Step fourUse the 'View dynamic group' drop-down menu to navigate between sub-groups of your results data.
Exporting ResultsYou have a variety of options for exporting your KS results data.
Select the 'Export results to csv' button to generate a spreadsheet of overall results data, including a personal curriculum of training topics for each user.
Select the 'Export training info to csv' button to generate a spreadsheet of training workshops, together with a corresponding list of users who have been identified as potentially needing to attend each workshop.
Select the 'Export training requests to csv' button to generate a spreadsheet of users who have flagged questions for further training. The report lists the highlighted questions and corresponding training tags.
Select the 'Export skipped questions to csv' button to generate a spreadsheet of users who hit the 'Skip question' button during their test session. The report lists the skipped questions and corresponding training tags.
Charting & Reporting KS ResultsThere are a range of charting and management reporting options available in your KS dashboard.
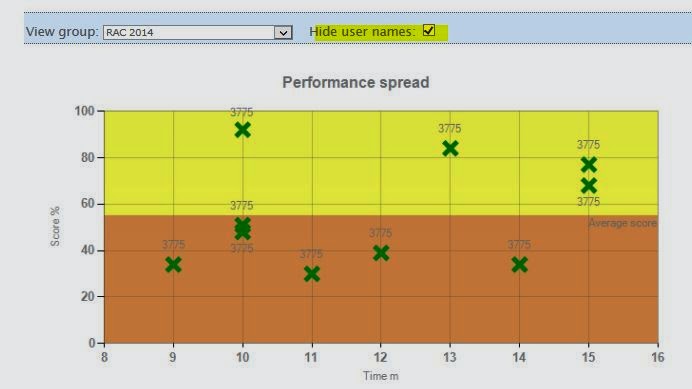
Performance Scatter
This chart displays group results in performance quartiles. The upper left quadrant (Q1) contains results, where the users completed their assessment accurately and fast.
The upper right quadrant (Q2) shows results which have high accuracy, but slower completion times. Bottom left (Q3) represents lower scores, but in a fast time.
Lastly, the bottom right quartile (Q4) shows test scores which are inaccurate and slow.
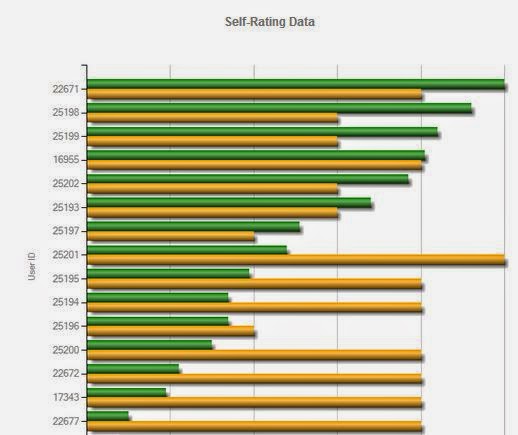
Training Requirements
This chart highlights training topics for a given group of test results. The logic analyzes all of the results for a group, references the training tags assigned to questions presented during a test and lists those tags in priority order.
Red indicates the tasks which have been answered incorrectly by most people in a given group. Orange is the next highest priority, followed by Yellow; green training tags are the topics which have been answered correctly by most of the group, so represent the least urgent issues.
For example; 10 people are presented with one or more questions, which include the tag, ‘Rooms’. If 7 of the 10 people answer one or more ‘Rooms’ questions incorrectly, then the keyword, ‘Rooms’, will be flagged at 70% and appear in Red on the chart.
You can also view charts for Training Requests and Skipped Questions on this page.
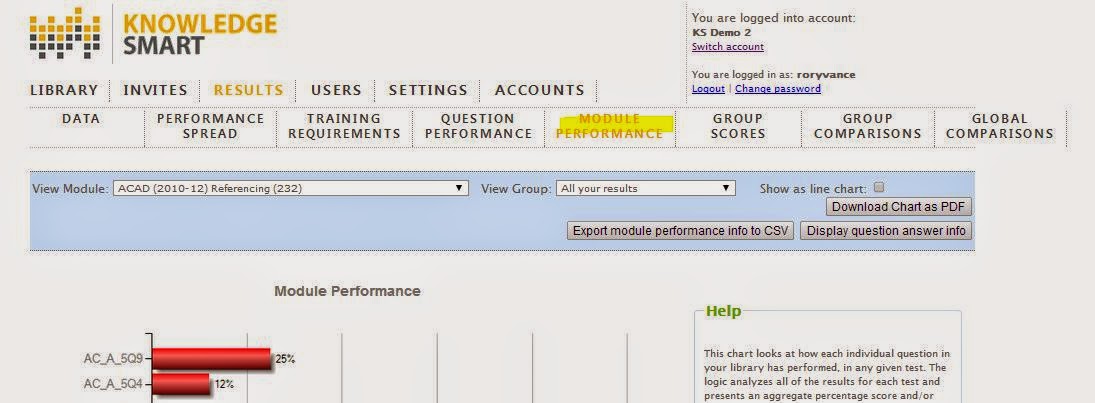
Question Performance
This chart looks at how each individual question in your library has performed, in any given test.
The logic analyses all of the results for each test and presents an aggregate percentage score for each question, divided by the total number of results for that test on the account.
For example; 10 people answer a question called ‘Doors’. If 7 of the 10 people answer the question 100% correctly, 1 person scores 50% and the other 2 score 0%, then the question will score an aggregate of 75% and appear in Yellow on the chart.
You can also create a chart for the average time taken to answer each question, by changing the radio button at the foot of the chart.
You can quickly view the relevant question data by clicking on each question name in the 'Question List' box, on the right hand side of this page.
Select the 'Export question performance info to csv' button to generate a spreadsheet which presents a breakdown of per question time & score values for each user.
Select the 'Display question answer info' button to view a table of 'required' vs 'submitted' answer values for each user. This is an easy way to identify an common mistakes or errors across multiple results.
We will shortly be adding a new page called 'Module Performance', which displays a per module breakdown of KS results data.
Group Scores
This chart displays user performance for any given group, in descending order. The X-axis shows the % score attained and the Y-axis displays user names.
Group Comparisons
This chart allows firms to compare performance, from one group to another, across (up to) 9 sets of data at a time. Group vs group comparisons can be used to compare a range of results data.
For example; pre and post-training performance, different project teams, offices from different geographic locations, data representing different job titles or industry disciplines, in-house data vs interview candidates, and so on.
Global Comparisons
This chart allows firms to compare in-house performance against a wider set of anonymous industry aggregate results data, for selected tests.
We will be adding new searching and reporting options in a future release, so you can analyse the user background info and demographics in greater detail. Regional benchmark stats and user profiles are a key theme for the global comparisons section.
So, there you have it, a comprehensive strategy for capturing, analysing and reporting on skills gap and training needs data for your organisation.
R


+chart.JPG)