Quantcast
Channel: The KnowledgeSmart Blog
Viewing all 112 articles
Browse latest View live

KS Devs Update

$
0
0


Here is a brief update of what's being discussed at our next tech team workshop. With thanks to our customer feedback forums for the majority of these suggestions.

Our current dev is progressing well. More detailed notes to follow shortly for each, but our top 2 current wishlist items are:

User dashboard pages
Survey questions

One those devs hit the live site, we'll take a look at the following:

CSV Export Consistency

Review CSV export across the KS dashboard to ensure it is behaving in a consistent manner.

Account Name in CSV Export

Many companies have multiple child accounts but would like to perform one csv export of all users.  However there is no clear identifier in the csv export as to which account each user belongs.  Include ‘Account Name’ in CSV exports.

Improved data selection in CSV Exports

Consider implementing ‘Field Chooser’ functionality for CSV exports.  When exporting a csv, the Admin User can select which fields to appear and save this selection for future exports.  We would also look to add further options such as ‘Full Name’ (concatenating first name and surname), ‘Training Tags – All’ and ‘Training Tags – Individual’ etc.  By making this functionality available in KS we can dramatically reduce the amount of time Admin Users need to spend outside of KS manipulating the data.

Allow admins to set up regular auto-reports (i.e. weekly/monthly/quarterly) which summarise key activities. For example:  Invites sent: Not started, In progress, Pending, Completed : Results, Scores within a certain range: User type: Test name(s): Date range: Select data for a particular account or accounts. Choose recipients. Full list of selection criteria to be workshopped.

Search /Grouping Criteria – Date Range

Extend search and group criteria across the system to allow the inputting of a date range.  This provides Admin Users with more powerful options when reviewing invites, results etc. Ensure consistency across all dynamic grouping filters. (Invite History/Results/Users).

Add Test Not Completed to Status Dropdown

Currently test invites do not have a single ‘Not Completed’ status.  If an Admin User wishes to identify all outstanding tests they would need to join together ‘Not Started’ and ‘In progress’. Amend grouping options to bring together these two into a single ‘Not Completed’.

Auto-Email when extending a test

When an Admin User extends the expiry date of a test invite, admins would like KS to send an email to confirm along with the new expiry date.  This could be managed in much the same way as the standard invites are with Admin Users having the option of amending the default text. Include option to add additional email addresses.

Increase Character Limit on Multiple Choice and Matching List Answer Options

Multiple choice questions currently have a limit of 50 characters per answer.  KS to review this to identify why the limit is in place (display purposes, database restriction etc) and if it can be extended. Also look at Matching List fields.

Default for Admins of Multiple Accounts

Where an Admin is managing multiple accounts, KS currently defaults to the first account in the list (alphabetically).  Admins have requested a change in this behaviour.  KS to consider alternative default selection options.

Add column in Invites – Date of last reminder/extension

When viewing invites KS currently displays when the invite was first sent and the date and time of the Users last login.  Admins would like an additional column which advises when the User was last reminded (either by reminder or date extension).

Remove Invites from system when a User is deleted

When a User is marked as Ex-Employee there is a clear requirement to retain their interaction with KS however when a User is deleted from the system, admins would like to have any outstanding invites (Not Completed) deleted from the system.


Additional Points for Discussion

More detailed benchmarking & analysis of user demographic & results data.

New API for LMS linking (esp. Olive/Absorb/Pinnacle).

Add number of results to Results > Data page.

Add date stamp to Global Comparisons view and export.

Add user count to training requirements chart.

Review display of Global question benchmark data.

Add question ID to training request csv export.

Improve page speed: Users > Users and Invites > History.

Investigate single sign-on and Active Directory links for user data import.

Investigate Content Delivery Network - adding zip files for test start to CDN environment.


R

AUGI Top DAUG 2014

$
0
0


KnowledgeSmart is partnering with the team at AUGI once again this year, for the annual Top DAUG skills contest at AU2014.

This year's contest is shaping up well, with 10 tracks planned for AU delegates.

Here's what we hope to include, using 2015 versions of the software:

3ds Max
AutoCAD 2D
AutoCAD Civil 3D
AutoCAD Plant 3D
Inventor
Navisworks
Revit Architecture
Revit MEP
Revit Structure
Vault

As in year's past, contestants will have just 10 minutes to answer a selection of knowledge-based and practical tasks, covering the main features of each application.

The person who posts the highest score, combined with the fastest time, in each track, will take the prize for their chosen topic. Then we analyse the data from all streams, to crown the overall winner of the Top DAUG contest.

Hope to see you at the Manadalay Bay!  #therecanbeonlyone

R

Top DAUG 2014 - The Results

$
0
0


This year, KnowledgeSmart and AUGI again teamed up to provide an interactive skills assessment, across 10 popular Autodesk software tracks: 3ds Max, AutoCAD, AutoCAD Civil 3D, AutoCAD Plant 3D, Inventor, Navisworks, Revit Architecture, Revit MEP, Revit Structure and Vault.

Once again, we had some great prizes up for grabs.  Track winners walked away with a $100 USD Amazon voucher (a combination of high scores and fastest times determined the winner of each track), a glass trophy and the overall winner won a HP laptop and free pass to AU2015.


We spent several hours on Tuesday, setting up 16 networked PC's in the exhibition hall, at the AUGI stand.

 Next, 144 copies of Autodesk software needed checking, then all the KS sample data sets had to be uploaded to each machine and checked again.  Big thanks to Tony Brown for his assistance in accomplishing this task.


Here's how we looked when everything was finished:


The main competition ran over 3 days (1 x 3 hour slot on day one, 2 x 3 hour slots on day two and a final 1 hour slot on day three). Contestants had to answer 8-10 questions, using the 2015 version of each software title. Each session was limited to just 12 minutes, so people had to work fast! Special thanks to awesome AUGI team members, Kristin, Bob, Michael, Donnia and Richard, for briefing users and making sure everything ran smoothly.

Here are the Top DAUG's in action:


By the end of the contest, we posted 215 results.

Throughout the competition, we displayed a rolling list of the top 10 contestants for each track, on the AUGI big screen.

The Results

Congratulations to the following contestants, who won their respective tracks:


And a special mention to the overall winner of AUGI Top DAUG 2014:

Tracy Chadwick


Analysis

So, let's take a detailed look at the results of this year's Top DAUG competition.

Overall

No. of Tests Completed:  215
Overall Average:  59% in 9 mins 14 secs
(NB the average score for 2013 was 48%).


Track 1 - 3ds Max

Track Winner: Herb Wagner
Winning Score: 55% in 11 mins 35 secs

Top 2 Contestants:


No. Completed: 2
Group Average: 35% in 11 mins 45 secs


Track 2 - AutoCAD

Track Winner: Tracy Chadwick
Winning Score: 100% in 3 mins 50 secs

Top 10 Contestants:


No. Completed: 68
Group Average: 63% in 8 mins 2 secs


Track 3 - AutoCAD Civil 3D

Track Winner: Christopher Fugitt
Winning Score: 88% in 5 mins 55 secs

Top 10 Contestants:


No. Completed: 21
Group Average: 66% in 9 mins 12 secs


Track 4 - AutoCAD Plant 3D

Track Winner: Patrick Alonzo
Winning Score: 72% in 11 mins 30 secs

Top 4 Contestants:


No. Completed: 4
Group Average: 52% in 10 mins 38 secs


Track 5 - Inventor

Track Winner: JD Mather
Winning Score: 81% in 11 mins 25 secs

Top 10 Contestants:


No. Completed: 21
Group Average: 41% in 11 mins 9 secs


Track 6 - Navisworks

Track Winner: Michael Doty
Winning Score: 60% in 6 mins 0 secs

Top 10 Contestants:


No. Completed: 13
Group Average: 49% in 9 mins 45 secs


Track 7 - Revit Architecture

Track Winner: Erik Eriksson
Winning Score: 99% in 10 mins 40 secs

Top 10 Contestants:


No. Completed: 47
Group Average: 57% in 10 mins 51 secs


Track 8 - Revit MEP

Track Winner: Ken Fields
Winning Score: 100% in 9 mins 15 secs

Top 10 Contestants:


No. Completed: 24
Group Average: 64% in 7 mins 32 secs


Track 9 - Revit Structure

Track Winner: Rebecca Frangipane
Winning Score: 85% in 8 mins 30 secs

Top 9 Contestants:


No. Completed: 9
Group Average: 70% in 9 mins 51 secs


Track 10 - Vault

Track Winner: Bryson Anderson
Winning Score: 60% in 6 mins 50 secs

Top 6 Contestants:


No. Completed: 6
Group Average: 53% in 6 mins 17 secs


Most Popular Tracks

The most popular tracks, in order of completed tests, were as follows:

AutoCAD - 68 results
Revit Architecture - 47 results
Revit MEP - 24 results
Inventor - 21 results
AutoCAD Civil 3D - 21 results
Navisworks - 13 results
Revit Structure - 9 results
Vault - 6 results
AutoCAD Plant 3D - 4 results
3ds Max - 2 results

Total = 215 results


Honourable Mentions

100% Club

The following people achieved a maximum score of 100% in their track:

Tracy Chadwick - AutoCAD
Glen Sullivan - AutoCAD
Christine Noble - AutoCAD
Ken Fields - Revit MEP
(Plus Erik Eriksson scored a tantalisingly close 99% in the Revit Architecture track!)


Top Performers

The following people demonstrated impressive versatility by achieving above average scores in multiple tracks:

Chris Brown - AutoCAD, Inventor and Navisworks
Tracy Chadwick - AutoCAD, Revit Architecture, Inventor and Vault
Seth Cohen - AutoCAD and Civil 3D
Jason Dupree - AutoCAD and Inventor
Ken Fields - AutoCAD and Revit MEP
John Fout - Navisworks, Revit Architecture and Revit Structure
Rebecca Frangipane - Navisworks, Revit Architecture and Revit Structure
Brent McAnney - AutoCAD, Civil 3D and Vault
Kate Morrical - AutoCAD and Revit Structure
Mohaimie Mosmin - AutoCAD and Inventor
David Rushforth - Navisworks, Revit Architecture and Revit MEP
Maxime Sanschagrin - Revit Architecture, Revit MEP and Revit Structure
Jim Swain - AutoCAD and Inventor
Nick Tanner - AutoCAD, Navisworks and Revit Architecture


Boys vs Girls

Finally, let's take a look at the demographic breakdown of the competition. Out of 215 contestants, 185 were male and 30 female. The average overall performance for each group breaks down like this:

Girls: 64% in 9 mins 25 secs
Boys: 58% in 9 mins 11 secs


So, that's Top DAUG finished for another year. A thoroughly enjoyable 3 days at AU2014. 215 completed tests, across 10 popular tracks. Once again, the overall standard was extremely high, with some outstanding individual performances from our track winners and top 10 contestants.

Congratulations to all our winners. Thanks to the AUGI team for their support. Lastly, a big thank you to everyone who took part in this year's contest.

See you all in 2015 at the Venetian for more fun & games!

R

KS Library Topics - Assessing Revit Architecture Skills

$
0
0


KnowledgeSmart skills assessment software helps firms of architects and engineers to measure software capability.

We have created an extensive range of assessments, covering the most popular design, engineering and BIM software titles, used by firms working in the global construction industry.

Assessments cover a range of popular vendors, including: Autodesk, Bentley Systems, Adobe, McNeel, Trimble and Graphisoft.

We work with a global network of world class authors. They are subject matter experts, published, thought leaders and working as consultants to industry, so they understand the practical application of the tools, as well as the menus and mouse-clicks. Popular KS authors include: CASE Inc, Chris Senior, Darryl McClelland, Eric Chappell, Envision CAD, Evolve, John Evans, Josh Modglin, Joel Harris, Paul Aubin, Paul Woddy, Revit Factory, Robert Manna, Scott Moyse, Scott Onstott, Tony Tedder, Thomas Weir and White Frog.

For our most popular assessments, we tend to create a variety of different modules, covering a range of different levels and abilities.

The current number one topic in our library is Autodesk Revit Architecture.  Here is a brief list of assessments available in our 'RAC Bundle'.  All of the following titles are available, as part of a KS Professional 1 license:

Revit Architecture for occasional users
Revit Architecture fundamentals
Revit Architecture – Xpress
Revit Architecture for Interiors
Revit Architecture advanced
Revit Content Creation
Revit Project Process
Revit Architecture – Extra qu's 1
Revit Architecture – Extra qu's 2
KS Community – Revit Architecture (White Frog)
KS Community – Revit Process & Workflow
KS Community – BIM Management (NB this one is software neutral, but included in the bundle)

So how does it all work?  In simple terms, it is a web based, practical test of knowledge and ability, so users will need access to a copy of the software, for which they are being assessed. They are presented with a series of task based and knowledge based questions, entering answers into the KS browser screen. At the end, a summary report with detailed feedback and coaching notes can be displayed to the user.  KS system administrators can access detailed reports, highlighting results, benchmark statistics and training recommendations.

Let's take a look at an actual example of our Revit Architecture fundamentals assessment, in this short video:


KS customers have full editorial control over all KS library material, so they are ultimately in the driving seat, as far as the material that is presented to their teams goes. And they have the option of writing custom question from scratch, using the KS authoring tools, if they want to capture knowledge on in-house work flows, standards and processes.

R

KS Spring Release - Individual User Pages

$
0
0


The most popular KS wishlist request in recent months has been to make it easier for individuals and admins to view assessment history and results data on a per user basis.

This also ties in with our wider goal to make the KS assessment tools more integrated with other Learning and HR systems, where data is shared across two or more platforms.

So we have created a new personal dashboard for individual users to log in and monitor their personal KS history, within their current organisation.

This resource will make it easier for individuals to manage their KS user profile, invite history, learning evidence and assessment results, including benchmarking data. Annual appraisals and performance reviews will be enhanced by the ability to capture multiple HR, training and learning resources in a single place.

The dashboard login page now has a new option, called My KnowledgeSmart.


Here is the KS user homepage, split into 4 main areas: My Details, My Achievements, My Assessments and My Scores.


The My Details page allows users to set their own password, edit personal information and update the 5 datafields which KS admins use to filter wider user and results data. They can also add a picture, to personalise their KS page.


The My Achievements page offers an opportunity to upload any useful documents and records relating to their personal development and learning history. For example, training completion certificates, exam results, certification evidence, CPD records, resume or professional record of achievement data.


Users can make documents 'public' or 'private' and create an individual URL for sharing learning resources online:


The My Assessments page enables users to view KS assessments they have taken or have been invited to take. They can view summary reports for completed sessions by clicking on the assessment name and resume open sessions by clicking on the name of 'Not started' or 'In progress' sessions and entering their KS user name and password in the following login screen.


Clicking on the 'Rosette' icon displays a new certificate, which users can share using social media or via email.


The My Scores page is a place for users to view all KS scores in one place.


Available data includes: benchmark comparisons, performance charts and skills gap summaries.


KS admins can access individual user pages via their main KS dashboard > Users page. There is a new icon which opens up the user page in a separate window.


KS admins can control access to user pages on a per user basis:


KS admins can also control user page access on a per account basis:


KS admins can also disable the 'sharing' tool, which appears when the certificate is viewed:


If a user record is deleted or set to 'Ex-employee' status, their personal page will no longer be accessible. User data is not portable, from one company to another. KS data is account-specific and owned by the organisation, not the user.

We anticipate this area of the KS system developing further, as the year progresses. If you have any ideas for integration with other systems, or if you have suggestions for new tools, charts, reports, and so on, please let us know and we'll add them to the summer wishlist.

R

Creating a Company Skills Matrix

$
0
0


A skills matrix, or competency framework, is a table that displays all required skills, tasks or abilities for a team or organisation, in one easy to view interface.

A training/competency matrix is a tool used to document and compare required competencies for a position with the current skill level of the people performing the roles. It is used in a gap analysis for determining where individuals have important training needs and as a tool for managing people development.

Benefits

•         Provides a comprehensive list of key skills the company has identified as worth cultivating.
•         Aids in managing training budgets because it identifies skill gaps across your organization.
•         Assists with planning by helping identify and target new skill areas that you might need.
•         Helps managers with development planning by identifying required skills.
•         Allows managers to add skills to employee profiles and set, monitor and change their level of expertise.
Allows employees to view the skills and skill levels their manager has attached to their profile.
Provides managers with clear areas for employee development that are directly connected to the organization’s identified HR priorities.
Enables managers to automatically include skills in review meetings.

Irrespective of what labels or names these levels are given, basically the levels mean: beginner level, learner level, skilled level, expert or master-skill level.


How to Build a Skills Matrix

1.    List the key roles in your organization.
2.    List the competencies required for each role.
3.    List the names of each individual for each role.
4.    Determine how you want to code the matrix to indicate skill level, training needed, etc.

Possibly use a colour coding system where:
Red = No skills in this area (1)
Amber = Partly trained in this area (2,3)
Green = Fully trained in this area (4,5)
Blank = N/A

5.    Fill out the matrix for each person to indicate current skills and any skill gaps.
6.    Look for patterns, opportunities, and areas of need.

In our summer release, we will be adding skills matrix functionality to our user pages area, enabling KS customers to create an easy to access database of searchable user skills and abilities.

R

Information is Beautiful

$
0
0
Skills assessments generate a lot of useful data. We have always been in the business of gathering information. And we have thousands of records to analyse. A key theme for KS this year is discovering new and interesting ways to anonymously present the findings of our global data capture.

As well as test topic, score & time values, we also capture optional additional background information about KS users, including:

Primary Industry/Discipline
Primary Role
Country
State (NB if US/CAN/Aus selected in 'Country' field)
Self rating (1-5)
How many years have you used BIM/CAD/Engineering software?
How often do you use BIM/CAD/Engineering software?
How did you primarily learn to use BIM/CAD/Engineering software?
Where did you first learn to use BIM/CAD/Engineering software? (Country/State) What BIM/CAD/Engineering software do you regularly use?
Please specify any other software.

Our goal in the coming months is to create a series of topical benchmarking stories from the information captured.

For example:

Average Revit Architecture test score/time for Architects based in California, using the software for 5 years or more, self-taught, part-time users, who learned in the USA.

Average Revit Structure test score/time for Structural Engineers based in NSW, Australia, using the software for 2-5 years, formally trained, full-time users, who learned in Australia.

Average MicroStation score/time for self-taught vs formally trained users.

Average AutoCAD score/time for < 5 year users vs > 10 year users.

And so on.

As you can see, there are dozens of possible permutations for interesting themes and stories buried in the data.  We just need to analyse and identify the best ones!

Here is one of our inspirations for creating amazing infographics:

Information is Beautiful by David McCandless.


Over the coming months, we'll share with you the most interesting stories, data-mined from our industry-leading skills assessment software.

R

Why self-assessment is (probably) fundamentally flawed (part one)

$
0
0
A while back, we wrote a paper about the pro's and cons of using self assessment, as an exclusive means of gaining useful corporate intelligence and capturing management metrics for staff performance.

Over the years, many AEC firms have confidently stated, 'We don't need independent skills testing, we already know how good our teams are'. When one enquires further, what they actually mean, is that they sent out a user survey, asking staff to rate themselves (usually out of 5) on a range of different skills topics, including AutoCAD, Revit, BIM, etc. What they end up with is a spreadsheet (why is it always a spreadsheet?) with a list of names down one side, a list of skills categories across the top - and a sheet filled with 3's and 4's. Why 3's and 4's, I hear you ask? Simply because people don't want to risk the personal penalties that might go along with admitting they're a 1 or a 2. And conversely, they don't want to stick their head above the parapet by admitting to a 5 (even if they are a 5) because this can cause all sorts of new issues (more work, more people pestering them for answers to the same questions, you get the picture). So it's 3's and 4's all the way.

Congratulations XYZ Engineers, you have your completed spreadsheet, so you are now totally self-aware, as an organization. (Not really). And the real rub here is that, more often than not, people have no clue how good they are, relative to the rest of the team, or wider industry!

So, we decided to explore this concept in greater detail. Here's the evidence..

Let us begin with a story. A few years back, NY Times Online posted a series of articles by filmmaker Errrol Morris. He tells the tale of Bank robbery suspect McArthur Wheeler, who was recognized by informants who tipped detectives to his whereabouts after his picture was telecast one Wednesday night, during the Pittsburgh Crime Stoppers segment of the 11 o’clock news. At 12:10 am, less than an hour after the broadcast, he was arrested. Wheeler had walked into two Pittsburgh banks and attempted to rob them in broad daylight.

What made the case peculiar is that he made no visible attempt at disguise. The surveillance tapes were key to his arrest. There he is with a gun, standing in front of a teller demanding money. Yet, when arrested, Wheeler was completely disbelieving. “But I wore the juice,” he said. Apparently, he was under the deeply misguided impression that rubbing one’s face with lemon juice rendered it invisible to video cameras.

Pittsburgh police detectives who had been involved in Wheeler’s arrest explained that Wheeler had not gone into “this thing” blindly but had performed a variety of tests prior to the robbery. Although Wheeler reported the lemon juice was burning his face and his eyes, and he was having trouble (seeing) and had to squint, he had tested the theory, and it seemed to work. He had snapped a Polaroid picture of himself and wasn't anywhere to be found in the image.

There are three possibilities:
(a) the film was bad;
(b) Wheeler hadn’t adjusted the camera correctly; or
(c) Wheeler had pointed the camera away from his face at the critical moment when he snapped the photo

Pittsburgh Police concluded that, 'If Wheeler was too stupid to be a bank robber, perhaps he was also too stupid to know that he was too stupid to be a bank robber - that is, his stupidity protected him from an awareness of his own stupidity.'

Now, this sorry tale might have been just another footnote in history, were it not for the fact that it came to the attention of David Dunning, a Cornell professor of social psychology. After reading this story in 1996, Dunning wondered whether it was possible to measure one’s self-assessed level of competence against something a little more objective – say, actual competence.

Over the next 3 years, Dunning (assisted by colleague Justin Kruger) undertook a major academic study and, in 1999, published the paper, “Unskilled and Unaware of It: How Difficulties of Recognizing One’s Own Incompetence Lead to Inflated Self-assessments”.

Dunning’s epiphany was; “When people are incompetent in the strategies they adopt to achieve success and satisfaction, they suffer a dual burden; not only do they reach erroneous conclusions and make unfortunate choices, but their incompetence robs them of the ability to realize it. Instead, like Mr. Wheeler, they are left with the erroneous impression they are doing just fine. In essence, our incompetence masks our ability to recognize our incompetence”.

Dunning & Kruger also quote the “above-average effect”, or the tendency of the average person to believe he or she is above average, a result that defies the logic of statistics. Participants scoring in the bottom quartile on tests grossly overestimated their performance and ability. Although test scores put them in the 12th percentile they estimated themselves to be in the 62nd.

Conversely, Because top performers find the tests they confront to be easy, they mistakenly assume that their peers find the tests to be equally easy. As such, their own performances seem unexceptional. In studies, the top 25% tended to think that their skills lay in the 70th–75th percentile, although their performances fell roughly in the 87th percentile.

Dunning and Kruger proposed that, for a given skill, incompetent people will:

  tend to overestimate their own level of skill;
  fail to recognize genuine skill in others;
  fail to recognize the extremity of their inadequacy;
  recognize and acknowledge their own previous lack of skill, if they can be trained to substantially improve.

As a follow up study, “Why the unskilled are unaware: Further explorations of (absent) self-insight among the incompetent”, was published in 2006. (David Dunning, Justin Kruger, Joyce Ehrlingera, Kerri Johnson, Matthew Banner).

In part two, we'll take a look at the 4 stages of competence - and how the combined illusions of memory, confidence and knowledge can impact on a firms' knowledge management strategy.

R

Why self-assessment is (probably) fundamentally flawed (part two)

$
0
0
This is part two of my case against the use of self-assessment, as a reliable exclusive means of measuring staff performance.

The Latin maxim “ignoramus et ignorabimus”, meaning "we do not know and will not know", stood for a position on the limits of scientific knowledge in the nineteenth century.

In September 1930, mathematician David Hilbert pronounced his disagreement in a celebrated address to the Society of German Scientists and Physicians, in Königsberg:

“We must not believe those, who today, with philosophical bearing and deliberative tone, prophesy the fall of culture and accept the ignorabimus. For us there is no ignorabimus, and in my opinion none whatever in natural science. In opposition to the foolish ignorabimus our slogan shall be: We must know - we will know!”

In the late twentieth century, Ex-United States Secretary of Defense, Donald Rumsfeld, whilst defending his country's position on the Iraq war, made the following (now infamous) statement; “There are ‘known knowns’. These are things we know that we know. There are ‘known unknowns’. That is to say, there are things that we now know we don’t know. But there are also ‘unknown unknowns’. These are things we do not know we don’t know”.
 
There are four recognised stages of competence.

1) Unconscious Incompetence
The individual neither understands nor knows how to do something, nor recognizes the deficit, nor has a desire to address it. The person must become conscious of their incompetence before development of the new skill or learning can begin.

2) Conscious Incompetence
Though the individual does not understand or know how to do something, he or she does recognize the deficit, without yet addressing it.

3) Conscious Competence
The individual understands or knows how to do something. Demonstrating the skill or knowledge requires a great deal of consciousness or concentration.

4) Unconscious Competence
The individual has had so much practice with a skill that it becomes “second nature” and can be performed easily. He or she may or may not be able to teach it to others, depending upon how and when it was learned.

"The Invisible Gorilla" experiment is one of the most famous psychological demo's in modern history. Subjects are shown a video, about a minute long, of two teams, one in white shirts, the other in black shirts, moving around and passing basketballs to one another. They are asked to count the number of aerial and bounce passes made by the team wearing white, a seemingly simple task. Halfway through the video, a woman wearing a full-body gorilla suit walks slowly to the middle of the screen, pounds her chest, and then walks out of the frame. If you are just watching the video, it’s the most obvious thing in the world. But when asked to count the passes, about half the people miss it. It is as though the gorilla is completely invisible.
(http://www.theinvisiblegorilla.com/gorilla_experiment.html).

In his popular KM blog, Nick Milton (http://www.knoco.co.uk/Nick-Milton.htm) writes in detail about the impact of this experiment and picks up on a number of key trends discussed in the book of the same name, authored by Christopher Chabris and Daniel Simons (the guys behind the original experiment).

The subtitle of the book is "ways our intuition deceives us", and the authors talk about a number of human traits (they call them illusions) which we need to be aware of in Knowledge Management, as each of them can affect the reliability and effectiveness of Knowledge Transfer.

To paraphrase Milton, the illusions which have most impact on Knowledge Management are;

• The illusion of memory
• The illusion of confidence
• The illusion of knowledge

Our memory of events fades over time, to the point that even firm documentary evidence to the contrary doesn't change what we remember. The implication is that if you will need to re-use tacit knowledge in the future, then you can't rely on people to remember it. Even after a month, the memory will be unreliable. Details will have been added, details will have been forgotten, the facts will have been rewritten to be closer to "what feels right".

Tacit knowledge is fine for sharing knowledge on what's happening now, but for sharing knowledge with people in the future then it needs to be written down quickly while memory is still reliable.

Without a written or photographic record, the tacit memory fades quickly, often retaining enough knowledge to be dangerous, but not enough to be successful. And as the authors say, the illusion of memory can be so strong that the written on photographic record can come as a shock, and can feel wrong, even if it’s right.

Any approach that relies solely on tacit knowledge held in the human memory can therefore be very risky, thanks to the illusion of memory.

The illusion of confidence represents the way that people value knowledge from a confident person. This would be fine if confidence and knowledge go hand in hand, but in fact there is almost an inverse relationship. A lack of knowledge is, instead, allied to overconfidence. Lack of knowledge leads to confidence, which leads to you being seen as knowledgeable.

Each chess player is given a points rating based on their competition results, which is in fact a very effective and reliable measure of their ability. Yet 75% of chess players believe they are underrated, despite the evidence to the contrary. They are overconfident in their own ability.

In studies of groups of people coming together to solve a maths problem, you would expect the group to defer to the person with the greatest maths knowledge, wouldn't you? In fact, the group deferred to the most confident person, regardless of their knowledge. In trials, in 94% of the cases, the final answer given by the group is the first answer suggested, by the most confident person present, regardless if whether it is right or wrong.

In a Harvard study of confidence vs knowledge in a trivia test, they certainly saw overconfidence in individuals - people were confident of their answer 70% of the time, while being correct only 54% of the time! When people were put together in pairs, the counterintuitive outcome was that the pairs were no more successful than the individuals, but they were a lot more confident! When two low-confidence people were put together, their overall confidence increased by 11%, even though their success rate was no higher than before.

The Illusion of Knowledge is behind the way we overestimate how much we know. The authors refer to how people think they know how long a project will take, and how much it will cost, despite the fact that projects almost always overrun in both cost and time. "We all experience this sort of illusory knowledge, even for the simplest projects" they write. "We underestimate how long they will take or how much they will cost, because what seems simple and straightforward in our mind typically turns out to be more complex when our plans encounter reality. The problem is that we never take this limitation into account. Over and over, the illusion of knowledge convinces us that we have a deep understanding of what a project will entail, when all we really have is a rough and optimistic guess based on shallow familiarity"

"To avoid this illusion of knowledge, start by admitting that your personal views of how expensive and time-consuming your own seemingly unique project will be are probably wrong. If instead, you seek out similar projects that others have completed, you can use the actual time and cost of these projects to understand how long yours will take. Taking such an outside view of what we normally keep in our own minds dramatically changes how we see our plans"

If we are unaware of these 3 illusions, we can feel confident in our knowledge, based on our memories of the past, without realising that the confidence is false, the knowledge is poor, and the memories are unreliable and partially fictitious. Awareness of these illusions allows us also to challenge the individual who confidently declares "I know how to do this. I remember how we did it 5 years ago", because we recognise the shaky nature of confidence, knowledge and memory.

A natural human tendency is that we tend to think that we know more than we do and that
we are better than we are. We suffer from what psychologists call the “Lake Wobegon effect”.
Based on Garrison Keillor’s fictional town where “all the women are strong, all the men are good-looking and all the children are above average.” According to the author’s own survey, 63% of Americans consider themselves more intelligent than the average American.

In contrast, 70% of Canadians said they considered themselves smarter than the average Canadian. In a survey of engineers 42% thought their work ranked in the top 5% among their peers. A survey of college professors revealed that 94% thought they do ‘‘above average’’ work – a figure that defies mathematical plausibility! A survey of sales people found that the average self-assessment score (for sales demos) was 76%. The average % of demo's that achieved objectives (for the same group) was 57%. The list goes on..

So, in summary, any strategy for capturing user skills data, which relies solely on an individual's ability to self-rate themselves on a given subject, is simply doomed to fail. I leave the last word to David Dunning; “In essence, our incompetence masks our ability to recognize our incompetence”.

R

Training Needs Analysis (TNA)

$
0
0
Popular AEC trainer and author, Shaun Bryant, is writing a 3-article series for AEC Magazine, about how design and engineering firms make the move to BIM.

Part one of the series can be found here.

In part two, Bryant addresses the issue of identifying training needs, in the context of a wider Revit software implementation.

Here is an excerpt from the article:

CAD manager to director level

“We will need to ensure that all Revit users undergo a Training Needs Analysis (TNA) to assess their training needs and requirements. This will give us a picture of exactly what they need and allow us to use the training effectively and get the most out of our incumbent training provider. It is imperative we allow the team to work with their strengths but also get trained up on areas of weakness, so that we have fully rounded Revit users that are effective and productive.”

CAD manager to the team

“We need you all to undergo a Training Needs Analysis (TNA). This is to assess your existing Revit knowledge (if you have any) and what areas you need to work on to make sure you are fully trained on every aspect of Revit you need to perform your role within the practice effectively. We need you to make sure that you include everything in your TNA so that we can get the best training for you from our training provider.”

Effective training on any CAD product is imperative. The CAD manager is using the TNA to ensure each Revit user is trained to their strengths and that any areas where their product knowledge is weak is thoroughly assessed and appropriate training given. The TNA is done individually per user to make sure that each user gets training tailored to them. It also provides the user with the reassurance that with the new CAD product, in this case Revit, they will be fully trained and prepared to use the product on live projects that the practice is, or will be, working on.

The full article can be found here.

KnowledgeSmart is a popular choice for AEC firms who are looking to capture accurate, independent data on software skills gaps, across their business. Detailed training needs analysis for individuals, teams and organisations is a key deliverable of the KS tools.

R

Assembling an “All-Star” Team

$
0
0
According to the Harvard Business Review, “…evidence from a variety of industries suggests that star employees outperform other employees by a country mile”.  Indeed in their 2013 article ‘Making Star Teams Out of Star Players’ the HBR wrote: “When it comes to an organization’s scarcest resource—talent—the difference between the best and the rest is enormous. In fields that involve repetitive, transactional tasks, top performers are typically two or three times as productive as others.”  KnowledgeSmart subscribers agree.

 “We know we’ve hired super stars when they score highly on KnowledgeSmart.  We also know that we can plug super stars into any team and they’ll increase team productivity.”

Peter Taylor, Engineering Systems Manager, Tata Steel Projects (TSP), Manchester, UK.

Taylor is responsible for reviewing emerging software offerings as he develops and maintains the strategy for best use of software on TSP projects. 

Being ‘KnowledgeSmart’ when resourcing Projects 

At Stantec – a multi-discipline AE firm with 15,000 employees – KnowledgeSmart skills analysis improves insight for management when comparing skills, knowledge, and performance across project teams.  Stantec also uses KnowledgeSmart to improve the productivity of teams and by balancing team skills.  

 “Where a team is already resourced, we use KnowledgeSmart scores to ‘Re-shuffle the deck’ so that we may better position people to maximise the effectiveness of their contributions.  For Stantec this ability to ‘course correct’ teams and individuals delivers increased efficiencies.”

 Jim Marchese, Corporate BIM Education Leader, Stantec, Philadelphia, USA.

It’s not just AEC firms who benefit by resourcing projects with the best talent.  HBR states that the best developer at Apple is at least nine times more productive than the average software engineer at other technology companies.

Daily Decisions Should be Data Driven

At A2K – one of the largest Autodesk channel partners globally with offices throughout Australia, New Zealand and China – they recognise that the world has changed.   They claim that with 20-20 insight into software skills, project team leaders can now resource projects with greater levels of certainty for higher quality outcomes.  

 “With customer loyalty programs gathering data about our every purchase and with Amazon predicting what we are ‘likely’ to ‘want’ to buy in future, BIG DATA has changed how we interact and behave.  In much the same way we can now use KnowledgeSmart BIM skills assessment results to remove emotion from the project team resourcing process, to guarantee the best outcomes.”

 Sean Twomey, ANZ Consulting Manager, A2K Technologies, Sydney, Australia.

Twomey is not alone; “Old school subjective assessments are unreliable.” explained Lonnie Cumpton, Senior Director of Professional Services at US CAD.  “Such assessments are mere opinions unsupported by facts.  And when the opinion is wrong it very often proves to be “an extraordinarily expensive way to do business.”  He concluded.

 Informed Inter-Team Mobility Delivers Productivity Gains

AT RTKL – a multi-discipline design practice with global presence – KnowledgeSmart is being used to make smarter, more well-informed data-driven decisions about people’s software skills when resourcing project teams.  

 “HR is involved in the process of project resourcing when new project teams are assembled.  HR knows ‘why’ people were hired and retains a high-level view of the firm’s talent base.  At RTKL, the nature of project-centric resourcing determines that individuals are moved from one project team to another as the workflow rises and falls across the project lifecycle.”

 Andrew Victory, Associate, RTKL, London, UK.

HOK agrees.  “HOK is committed to making sure every team member’s skills and knowledge are as deep and as broad as can be to streamline the project resourcing process.”

 Even Super Stars Need to Train

Back at Stantec, the HR department recognises that super stars are not ‘born’ they are ‘developed’.  From years of experience, Stantec knows that world-class talent of all kinds will multiply the productivity and performance advantages of an all-star team.

 “By providing JIT training we are making it easier to resource projects.  We can select the right people for a given project based on their domain skills and using KnowledgeSmart skills assessments we can identify and eliminate skills gaps by completing targeted ‘small sip’ training modules.”

Susan Clark-Serediuk, HR Leader, Stantec, Toronto, Canada.

In this way Stantec is gradually assembling a series of all-star teams.

HBR’s key takeaway

 “Companies that are good at managing “A” players keep comprehensive, granular data on where their people are currently deployed, what those people do, how good they are in their current roles, and how transferable their skills may be.”

KnowledgeSmart companies use that information to continually improve their staffing resources and to deploy them more effectively.

R

A Well-trained User is a User for Life

$
0
0
In April 2015 a brief published by “Bersin by Deloitte” reported that “…organizations which perform well on business outcomes have a talent strategy.” It went on “…of those organizations rated least effective at business outcomes, between 70 percent and 80 percent lack a talent strategy.” Naturally the ‘Learning Strategy’ is an essential ingredient of any successful talent strategy.

 
It should therefore come as no surprise that KnowledgeSmart subscribers may fall into the top 20% of all similar organisations as they are able to identify skills gaps, target training investment, and report measurable productivity gains with a clarity that is otherwise out of reach.


“We couldn’t have achieved such marked levels of increased productivity without a total solution for skills analysis and improvement.”


Peter Taylor, Engineering Systems Manager, Tata Steel Projects, Manchester, UK.


While an organisation’s talent is a strategic priority, skills improvement is a functional requirement for improving team productivity and data quality when collaborating on AEC and BIM projects.


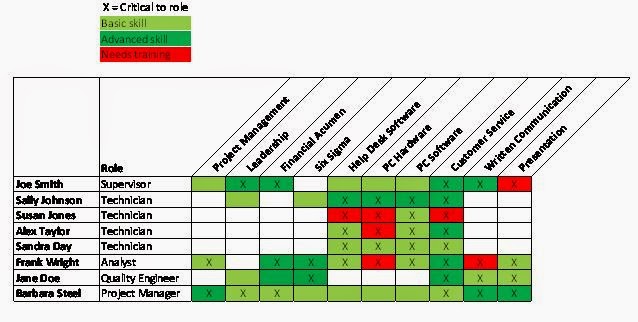
Using KnowledgeSmart to demonstrate BIM-readiness

 
At USCAD – a BIM and manufacturing industry consultant and one of the largest Autodesk Authorized Platinum Reseller Partners in the USA – the transparency afforded by KnowledgeSmart’s Revit skills assessment results is clear.  


“As firms are fighting hard to win new projects, many say they are “BIM ready” but few can truly prove they are “BIM Ready” without skills assessment results as proof to validate their claims.  Including ‘BIM’ on your resume is no longer a reliable indicator of competence; you have to back up your claims with hard facts.”


Jeff Rachel, Vice President, USCAD, Las Vegas, USA.


The US CAD team leads by example, using KnowledgeSmart skills analysis services to assess their own staff and to support their business case when pitching to supply professional services and training.


Thinking Outside of the Box

 
North American firm Stantec – a multi-discipline AE firm with 15,000 employees – has turned training on its head since adopting KnowledgeSmart.  Gone are the days of training staff to use software without first assessing their abilities; the process was too long winded and too expensive and in many instances quite unnecessary when a user already had strong CAD and BIM software abilities.


“We have named our strategy for learning and development ‘Flipping the Classroom’ because the process for skills improvement and assessment has been reversed.  Today, a user’s BIM skills are assessed using KnowledgeSmart before they register for any training courses.  We then use the results to analyse and recommend specific training modules to help the user fill in their knowledge gaps as identified by their KnowledgeSmart score.”


Jim Marchese, Corporate BIM Education Leader, Stantec, Philadelphia, USA.


As a bonus, Stantec leadership now enjoys better reporting insight into CAD and BIM productivity and skills;  using the KnowledgeSmart skills gap analysis to provide insight and a business case for continued training investment.


Using KnowledgeSmart Scores to Build a Business Case for Training


A2K Technologies is one of the largest Autodesk channel partners globally with offices throughout Australia, New Zealand and China.  A2K is also a KnowledgeSmart advocate:


“Training decisions are easier to make when informed by needs.  The days of filling classrooms with people to sit through a multi-day training course are numbered.  Using skills assessment services from KnowledgeSmart we are now able to tailor our training courses to their skill level.  Saving valuable time and budget for additional activities.”


Sean Twomey, ANZ Consulting Manager, A2K Technologies, Sydney, Australia.


Some firms are using their KnowledgeSmart assessment scores to build a business case for securing training investment.  By first demonstrating a need to train, the training investment is easier to secure.  Better still, post training assessments are a proof point for skills improvement and demonstrate measurable return on investment (ROI).


Plugging Skills Gaps via Bite-sized Training


As new software is released and adopted, upgrade training is required to maximise the benefit realised.  However, many teams cannot spare large chunks of time away from their desk when a project is active.


“Big-Gulp training isn’t easy to fund or organise:  It takes people away from project work for too long in one sitting, and it is disruptive to production workflows.  For Stantec as a large geographically distributed enterprise we find that ‘self-paced’ modular training makes more sense.  By first testing our staff to benchmark their skills we can very efficiently prescribe a learning development path which limits time away from the project and maximises the new skills learned.”


David Spehar, Corporate BIM Lead, Stantec, Stantec, Cleveland, USA.


By combining one of the many online self-paced learning environments with KnowledgeSmart, subscribers will increase their learning efficiency and reduce their training costs to spend more time delivering projects.


Training can be a Team Sport – But Not Always

 
At RTKL – a multi-discipline design practice with global presence – training is regarded as a group activity, often delivered via online technology to enable a very open and flexible forum for discussion.  


“Such group sessions can be very hard to manage effectively as there is invariably a delta between the stronger and weaker users which can leave some feeling overwhelmed while others may feel bored as the training lacks pace.”


Andrew Victory, Associate, RTKL, London, UK.


For RTKL however this is no longer an issue.  Using KnowledgeSmart’s online skills assessments, RTKL first assesses each user’s skills before grouping users by ability for training.  And as HR owns the training budget – allocating it as needs demand – KnowledgeSmart helps to make the budget go as far as possible by benefitting the neediest for maximum training ROI.


Playing the Long-Game and Trusting KnowledgeSmart Scores

 
HOK – a global design, architecture, engineering and planning firm with a network of 24 offices on three continents – is now in its 4th year with KnowledgeSmart and has taken its time to build up a depth of knowledge through annual skills assessments.


“The whole team is now able to trust the KnowledgeSmart assessments and results to clearly connect skills improvement to training investment.  We have learned lots of back-end lessons using KnowledgeSmart, most notably, we have realised how and where we can improve productivity and profitability for the whole company.”


David Ivey, Building Smart Manager, HOK, Chicago, USA.


Today annual skills assessment results indicate areas which require improvement and bite-size training courses are arranged through the “HOK University” – a global learning initiative setup for all HOK staff to improve skills in all work-related areas including CAD and BIM software.


Training Content Providers use KnowledgeSmart Score to Improve their Own Offerings

 
White Frog offers strategic educational planning when adopting BIM technology and workflows and works with AEC firms to select, refine, and apply standards and protocols for BIM use prior to adoption.  Generally all training programs embrace AEC Standards and where necessary include other international standards such as those from the USA including LEED, AIA, etc.


“We offer the opposite of ‘BAG’ training (Basic, Advanced, Good Luck!).  We start by assessing all existing Revit users with KnowledgeSmart before they embark on a rolling Revit learning program.  We also use KnowledgeSmart to inform our own developments.  By reviewing test results from our customers we can sometimes identify areas of our own training materials and processes that need to be improved.  For instance if some questions never get a strong score it may be because there are improvements required to our service delivery and training course creation.  So we use those test results to improve our own offerings.”


Paul Woddy, Technical Director, White Frog, Shrewsbury, UK.


Before adopting KnowledgeSmart, White Frog reviewed other skills testing solutions but found them all wanting in one way or another.  Some offered no randomisation of questions while others were missing robust analysis and insight tools.  For the BIM experts at White Frog, KnowledgeSmart was the only complete solution.


Using KnowledgeSmart Services to Maximise the Value of Software and Training Subscriptions

 
Tata Steel Projects (TSP) – a multi-disciplinary engineering consultancy working on rail, nuclear, security, energy, power and construction – is a mixed Bentley and Autodesk shop that has an Open Access agreement with Bentley for software procurement.  TSP tested the skills of every single user in their organisation via KnowledgeSmart and then analysed the results to identify skills gaps/trends and build custom learning paths to streamline access to rich learning resources in Bentley LEARN including online videos, tutorials, virtual classroom, etc.


“One year later, after completing targeted training, our retest scores are 30-40% higher; providing substantial return on investment (ROI).  We couldn’t have achieved these levels of improvement without a total solution for skills analysis and improvement.”


Peter Taylor, Engineering Systems Manager, Tata Steel Projects, Manchester, UK.


KnowledgeSmart is now central to TSP’s talent strategy.  All future assessments will be administered by HR and tied in with annual appraisals for continued skills improvement.
 
R

The Smartest Human Resources Officers are 'Knowledge Smart'

$
0
0
According to www.Prospects.ac.uk (the UK's leading student and graduate careers advice service) Human Resources (HR) Officers must have a clear understanding of their employer's business objectives and be able to devise and implement policies which select, develop and retain the right staff needed to meet these objectives.

The smartest HR Officers are therefore subscribing to KnowledgeSmart to assess the CAD and BIM skills of new hires and to guide skills improvement over time.

We use KnowledgeSmart to enable our clients to recruit smarter candidates and to prove their ability; we find that it ensures better outcomes. By replacing guesswork with the KnowledgeSmart skills assessment, our clients know precisely how and where their candidates will add value to their organisation before they hire them.

Mike Johnson Managing Director, JohnsonBIM, London, UK

In addition, HR Officers use KnowledgeSmart skills assessments to:

- Liaise with team leaders to identify skills gaps and improve staff performance;
- Interview and select job candidates;
- Develop and implement policies for performance management;
- Advise on pay and other remuneration issues, including promotion and benefits;
- Plan, and sometimes deliver, training - including inductions for new staff;
- Analyse training needs in conjunction with departmental managers.

With subscribers spread across 6 continents KnowledgeSmart online skills assessments are used by architects, engineers, construction firms and contractors, to great effect.


Using KnowledgeSmart Skills Assessments to Inform Annual Appraisals

At HOK – a global design, architecture, engineering and planning firm with a network of 24 offices on 3 continents – the HR team actively supports staff to be the best they can be. This in turn delivers significant value for individuals and the organisation at large. With a focus on continuous improvement, HOK's skills assessment results are reviewed annually as part of the appraisal process and continuous improvement is rewarded through the company bonus scheme and through improved promotion opportunities.

We have learned lots of back-end lessons using KnowledgeSmart. Most notably, we have realised how and where we can improve productivity and profitability for the whole company.

David Ivey Building Smart Manager, Chicago, USA

HR teams, operating at the highest level within HOK, welcome this approach to integrated assessment and support the Building Smart Managers in their work. With similar motivations for improved service and performance, Stantec – a 15,000-person strong professional services firm – is embracing KnowledgeSmart to proactively make skills development a corporate initiative.

We have made the employee and his supervisor responsible for identifying goals and for measuring progress as part of the annual review process. This empowers and supports teams and enables individuals to reach their full potential and KnowledgeSmart is an invaluable ingredient.

Susan Clark-Serdiuk HR lead at Stantec, Toronto, Canada


HR Officers are Increasingly Knowledge Smart when Hiring New Staff

Smart recruitment firms and HR Officers are turning to KnowledgeSmart for insight when hiring. Gone are the days of simply sifting through CVs and arranging interviews, firms now demand more from their recruitment teams.

Hiring new staff without first assessing their BIM and CAD skills is an extraordinarily expensive way to do business as many firms may not learn how bad the new recruits have performed until much damage is done to the project's data quality. With KnowledgeSmart BIM Skills Assessments we gain the insight we need to make the right decisions.

Senior Director of Professional Services, US CAD, California, USA

To avoid such unnecessary expenditure and to reduce their risk, California-based US CAD invites all job candidates to complete a KnowledgeSmart BIM skills assessment and makes it clear from the outset that there is no intention to fail anyone. US CAD openly uses the BIM skills assessment results to better plan for training needs and to benchmark a candidate's assessed-ability against his own claimed-ability to better understand the individual.


HR Officers are Bringing KnowledgeSmart Results to the Project Resourcing Table

At RTKL – a worldwide architecture, engineering, planning and creative services organization – HR leadership challenged its BIM management team to source a BIM skills analysis tool to help the firm make smarter, more well-informed data-driven decisions about people's CAD and BIM skills when resourcing project teams. The team reviewed the market and selected KnowledgeSmart.

HR generally understands 'why' people were hired and provides a high-level view of the firm's talent base, but historically it has not fully appreciated some of the finer details about CAD and BIM skills. The nature of project-centric resourcing determines that individuals are moved from one project team to another as the workflow rises and falls across a project's lifecycle, and their BIM skill-levels will critically influence their ability to contribute to their new team. With KnowledgeSmart results and analysis in hand, HR now has perhaps the most comprehensive oversight of all staff and their skills.

Andrew Victory Associate, RTKL, London, UK


Identifying Skills Gaps for Training Needs Analysis by HR Teams

Australian-based A2K Technologies – one of the largest Autodesk channel partners globally – finds that HR Officers are very often involved in purchase decisions for training. Furthermore, A2K finds that HR Officers are very interested in benchmarking for greater insight into team performance; enabling them to extend their role beyond welfare and Health & Safety.

As the recession fades and growth again is the driver for change, firms are increasingly motivated to retain their best staff. KnowledgeSmart helps HR Officers measure their teams' software skills as part of their culture to support, reward and retain value-adding staff.

Sean Twomey ANZ Consulting Manager, A2K Technologies, Sydney, Australia

A2K also believes that KnowledgeSmart provides younger staff with targets to aim for; finding that KnowledgeSmart results can contribute to the building of a framework for ambition and career growth.

If you are a HR Professional, looking for a better way to measure staff skills and interviewee experience, why not get in touch and request a free trial of the KS tools?

R

KS Devs Update

$
0
0
So, the children are back to school and summer in the UK is fast becoming a memory. The autumn rains are upon us, which means it must be KS Devs update time!

We've had a busy year in 2015, keeping the KS library titles up to date with the latest releases. We've also been working steadily through the customer wishlist, improving existing tools and adding some new ones into the mix.

Here are the highlights..

New Query Tool

We've been working on new and improved ways to filter and search KS results, users and invites data.  This will be a 3-phase dev, as follows:

Phase 1

Create new query tool. We have built a new tool for searching, filtering and capturing KS data.


Query outputs can be captured in a table and exported to csv.


We are capturing a list of popular 'pre-defined' queries, which can be copied and edited.

For example:

Most popular test topics by number taken 
Average score and time for top 5 test topics
Global benchmark comparison for top 5 test topics
Users who have 'incomplete tests' 
Last 20 results: user names, test names, scores & times
Top 20 skills gaps (i.e. training tags)
Top 20 hardest test questions (i.e. lowest scoring average)

And so on.


Phase 2

Allow KS admins to perform a series of bulk actions, with the results of a query.  

For example:

Delete users
Move users from one account to another
Invite users to a test
Delete results
Move results from one account to another
Delete invites
Change invite expiry date
Re-send invites

And so on.


Phase 3

Graphics & charts: we aim to display summary fields on  a new dashboard landing page.

For example:

No. of invites sent in last 30 days
No. of completed tests in last 30 days
No. of incomplete tests in last 30 days
Most popular test topics by number taken
Average score and time for top 5 test topics
Average score for Employees vs Interviewees
Global benchmark comparison for top 5 test topics
Last 20 results: user names, test names, scores & times
Top 20 skills gaps (i.e. training tags)
Top 20 hardest test questions (i.e. lowest scoring average)

Plus offer an auto email report to KS admins, which can contain custom values and timescales.


Survey Tool

We have built a survey tool, which sits inside the KS admin dashboard and allows you to create a hybrid assessment/survey. For those times when you want to include questions in the mix, which don't have a 'right or wrong' answer. The UI is mobile responsive and captures survey results and charts in the same KS admin dashboard, for further analysis.


Other Items and a look ahead to 2016

Add Ecommerce page to KS site 

Helpdesk part 1: Add new 'Support' section in admin dashboard. Simple form to complete for tech support which is captured in KS CRM system. Future updates may follow, if more functionality and issues log is required.

Design refresh on main dashboard login page/password reset page: make page mobile responsive. 

Go live with new KS test report design.

Design refresh on main test taking UI: make mobile responsive;  add 'confidence meter' and associated admin dashboard links.

API calls: we have an ongoing dev with a third party vendor, to add more integration to training material hosted in their LMS.

Admin UI design refresh.

System mails: Revisit logic for KS system mails (invites, results, reminders) and how admins/others are copied on system mails. 

Allow more than one user group/dynamic group to be selected at a time when sending invites.  

Allow selection of default landing account for admins of multiple accounts.

Allow bulk copy & paste of emails on invite page.

Allow bulk upload/import of KS questions.

Key skills search tool.


As always, we'll keep you  posted as these devs progress to go live status.

R

KS Country Stats

$
0
0
In the course of carrying out multiple thousands of skills assessments in recent years, we have gathered a wide range of fascinating and useful user demographic data. In the months ahead, we will be presenting a range of information, which can be used for measuring, comparing and benchmarking performance.

Let's take a look at some overall aggregate score data, across a number of different KS library test topics, on a country vs country basis. Numbers of test scores vary, so this list does not imply that one country is 'better' than another, per se. It's just interesting to see what kind of data is generated in different parts of the globe.

CountryScore %
Argentina75.6
Vietnam72.0
Nigeria71.6
Poland69.8
USA69.6
New Zealand69.0
Singapore68.1
Sweden67.3
Hong Kong66.4
Saudi Arabia65.9
Bahrain65.8
Australia 65.5
Egypt65.4
France65.2
Canada 64.7
UK63.0
Spain62.2
UAE61.7
Portugal60.8
South Korea58.8
Jordan58.3
China57.1
Ireland55.7
Germany55.3
South Africa53.5
Philippines52.6
India52.4
Qatar52.4
Italy51.9
Kuwait51.2
Brazil46.0
Oman45.9
Pakistan45.2
Denmark45.1


We also capture data on a per State basis, for our US customers. The list below represents those States where the volume of data makes for meaningful data sharing (i.e. if any States are missing, the overall number of tests taken is too low to publish).

US StateScore %
Illinois76.9
Nevada75.1
Virginia74.9
Missouri74.4
Louisiana74.0
Michigan73.6
Ohio73.5
Delaware73.4
District of Columbia73.1
Utah72.9
Texas72.1
Minnesota71.0
Wyoming71.0
Oregon70.5
Mississippi70.1
USA (overall)69.6
Wisconsin69.0
Pennsylvania68.9
California68.8
Kentucky68.0
New York68.0
Georgia67.6
Massachusetts67.6
Maryland67.5
Alabama67.4
Florida66.4
Kansas65.9
New Jersey65.7
Washington64.1
South Carolina63.1
North Carolina60.7
Hawaii59.7
Colorado58.6
Arizona57.5
Nebraska48.8


R

Benchmark Stats for Popular KS Test Titles

$
0
0
Benchmarking software capability at individual, team and office level is a key part of the KnowledgeSmart experience.

Our library of skills assessments for the AEC industry covers a variety of  popular software tools, used on projects on Construction projects worldwide.

Our results data comes from a wide variety of countries and territories, including: US, UK, Australia, Canada, New Zealand, South Africa, Singapore, Vietnam, India and the Middle East.

Here is the overall average results data for our most popular topics (% score and time to complete):

Test Title% ScoreTime
3ds Max fundamentals54.557m
Adobe InDesign occasional6445m
Adobe Photoshop occasional6248m
AutoCAD 2D fundamentals54.51h 18m
AutoCAD 2D occasional73.136.5m
AutoCAD Civil 3D fundamentals67.21h 3m
AutoCAD Civil 3D advanced52.245.5m
AutoCAD Plant 3D fundamentals6353m
Bentley ABD fundamentals51.51h 28m
Bentley ProjectWise fundamentals591h 3m
BIM Management68.546m 
InfraWorks 360 fundamentals58.51h 2m
Inventor fundamentals641h 15m
MicroStation 2D fundamentals59.31h 24m
MicroStation 3D fundamentals52.558m
Navisworks fundamentals58.443m
Revit Architecture fundamentals68.51h 18m
Revit Architecture advanced57.11h 24m
Revit Content Creation57.81h 3m
Revit MEP fundamentals - Electrical63.71h 6m
Revit MEP fundamentals - Mechanical62.21h 7m
Revit MEP fundamentals - Plumbing70.11h 11m
Revit MEP advanced53.31h 2m
Revit Project Process56.446.5m 
Revit Structure fundamentals67.11h 12m
Revit Structure advanced57.21h 4m
Rhino61.244.5m
SketchUp53.450m


KnowledgeSmart independent skills testing enables businesses to compare performance and capability against industry standards and benchmark their organisation against peers, competitors and partners. Measuring and demonstrating technical software experience and BIM capability is a key differentiator for AEC firms when bidding for new projects.

R

AutoCAD Test Scores Around The World

$
0
0
According to Wikipedia, AutoCAD is defined as 'a commercial software application for 2D and 3D computer-aided design (CAD) and drafting, available since 1982 as a desktop application and since 2010 as a mobile web and cloud-based app'.

The 2016 release marked the 30th major release of AutoCAD for Windows. The 2014 release marked the fourth consecutive year of AutoCAD for Mac.

Over the years, KnowledgeSmart has captured test scores for thousands of AutoCAD users, in multiple countries across the globe.

Here are the variances in our overall benchmark data, from 2009 to 2015:

2009
Average Score:59.5%
Average Time:1 hr 16 mins

2010-12
Average Score:61.0%
Average Time:1 hr 18 mins

2013
Average Score:62.0%
Average Time:1 hr 13 mins

2014
Average Score:62.0%
Average Time:1 hr 10 mins

2015
Average Score:58.5%
Average Time:1 hr 13 mins


Let's take a look at some overall aggregate score and time data on a country vs country basis. Numbers of test scores vary, so this list does not imply that one country is 'better' than another. It's interesting to see what kind of data is generated in different parts of the globe.

CountryScore (%)Time (secs)
Australia63.34777.9
Bahrain61.84330.0
Canada47.13395.0
China54.67542.8
Hong Kong37.73610.0
India49.14203.8
Ireland49.55573.8
Kuwait45.73741.4
New Zealand69.74399.8
Oman39.35649.2
Philippines50.34881.8
Poland62.03150.0
Qatar50.95003.4
Saudi Arabia60.53361.3
Singapore49.44752.0
South Africa49.24468.0
Spain62.73481.0
UAE62.65112.7
UK53.44572.3
USA 61.35511.8


We also capture data on a per State basis, for our US customers. The list below represents those States where the volume of data makes for meaningful data sharing.

StateScore (%)Time (secs)
USA (all)61.35511.8
California63.45580.1
Florida70.63140.9
Georgia48.45096.4
Louisiana67.33263.3
Nevada75.33282.8
New York52.65444.5
Washington45.57336.9


Score and time data varies quite considerably, from country to country and between US States.

Even though the software has been commercially available for over 3 decades, there are still notable skills gaps across the overall user base. Our data shows quite clearly that AutoCAD users reach a performance 'plateau' after about 5 years and then remain at a similar skill level in subsequent years. 

When we started capturing skills data in the AEC industry, over 10 years ago, AutoCAD was the principal tool of choice for design and engineering firms. Whilst still widely used, the growth of BIM in the Construction sector has seen a rise in the number of different software tools deployed on projects  in the built environment.  Users must now learn a wider variety of software tools to do their jobs, than in years past.

R

AutoCAD Civil 3D Test Scores Around The World

$
0
0
AutoCAD Civil 3D is a popular civil engineering design and documentation software solution, owned and developed by Autodesk.
 
Over the years, KnowledgeSmart has captured test scores for a significant number of Civil 3D users, in several countries worldwide.
 
Here are the variances in our overall benchmark data, from 2013 to 2015:
 
2013
Average Score: 56.0%
Average Time: 1 hr 16 mins

 
2014
Average Score: 58.0%
Average Time: 1 hr 13 mins

 
2015
Average Score: 67.2%
Average Time: 1 hr 3 mins


Let's take a look at some overall aggregate score and time data on a country vs country basis. Numbers of test scores vary, so this list does not imply that one country is 'better' than another. It's interesting to see what kind of data is generated in different parts of the globe.
 
CountryScore (%)Time (secs)
Australia69.13425.0
Canada70.23323.3
Hong Kong63.03500.2
Philippines62.84131.7
South Africa53.62458.4
UAE51.83947.1
UK67.82305.9
USA 69.63316.2

 
We also capture data on a per State basis, for our US customers. The list below represents those States where the volume of data makes for meaningful data sharing.

StateScore (%)Time (secs)
USA (all)69.63316.2
California70.24172.2
Colorado54.05201.9
Delaware73.52568.1
Florida78.82273.2
Hawaii56.84061.9
Kansas66.04927.5
Maryland61.24472.4
Massachusetts70.43548.9
Missouri53.35014.2
Nevada74.82707.5
New Jersey74.83487.2
Pennsylvania69.62467.9
Texas68.02452.5
Vermont72.02995.3
Virginia77.13555.1
Washington64.02812.5
Wyoming71.03248.3
 
 
Much of our Civil 3D data originates in the USA, where the tool is widely used on Infrastructure projects. As with the majority of our assessment data, Civil 3D capability varies from country to country and between US States. North American users have a 20%+ variance across different territories.
 
R

Bentley MicroStation Test Scores Around The World

$
0
0
MicroStation is a CAD software product for two and three dimensional design and drafting, developed and sold byBentley Systems.

Over the years, KnowledgeSmart has captured test scores for thousands of MicroStation users, in several countries worldwide.

Here is our overall benchmark data, from 2011 to 2015:

V8i
Average Score: 59.3%
Average Time: 1 hr 24 mins

Let's take a look at some overall aggregate score and time data on a country vs country basis. Numbers of test scores vary, so this list does not imply that one country is 'better' than another. It's interesting to see what kind of data is generated in different parts of the globe.

CountryScore (%)Time (secs)
Australia58.74873.3
Canada57.75172.2
China65.03965.7
India54.74660.0
Ireland57.06195.0
Oman55.06620.4
Portugal63.06680.6
S. Africa62.46801.3
Spain61.24420.0
UAE58.24145.2
UK61.34859.4
USA59.25573.6


We also capture data on a per State basis, for our US customers. The list below represents those States where the volume of data makes for meaningful data sharing.

StateScore (%)Time (secs)
USA (all)59.25573.6
California59.85567.5
Florida64.74300.8
Indiana55.13960.3
Kansas58.84600.4
New York66.24025.2
North Carolina53.75810.1
Texas61.46225.0

As with AutoCAD, even though the software has been commercially available for many years, there are still notable skills gaps across the overall user base. Our data shows that MicroStation users reach a performance 'plateau' after about 5 years and then remain at a similar skill level in subsequent years. 

MicroStation has traditionally maintained a strong base in Rail and Infrastructure projects, with a large legacy .dgn file format history in this sector.

R

Revit Architecture Test Scores Around The World

$
0
0
Autodesk Revit is building information modeling software for architects, structural engineers, MEP engineers, designers and contractors. It allows users to design a building and structure and its components in 3D, annotate the model with 2D drafting elements, and access building information from the building model's database. Revit is 4D BIM capable with tools to plan and track various stages in the building's lifecycle, from concept to construction and later demolition.

Over the years, KnowledgeSmart has captured test scores for thousands of Revit Architecture users, in multiple countries across the globe.

Here are the variances in our overall benchmark data, from 2010 to 2015:

2010
Average Score: 63.0%
Average Time: 1 hr 11 mins

2011
Average Score: 65.0%
Average Time: 1 hr 15 mins

2012
Average Score: 69.0%
Average Time: 1 hr 5 mins

2013
Average Score: 69%
Average Time: 1 hr 3 mins

2014
Average Score: 70.0%
Average Time: 1 hr 1 mins

2015
Average Score: 68.5%
Average Time: 1 hr 8 mins


Let's take a look at some overall aggregate score and time data on a country vs country basis. Numbers of test scores vary, so this list does not imply that one country is 'better' than another. It's interesting to see what kind of data is generated in different parts of the globe.

Revit Architecture Fundamentals

CountryScore (%) Time (secs)
Australia69.44736.5
Bahrain73.24493.3
Canada70.14341.4
China63.56178.3
Egypt68.14290.2
Hong Kong73.55096.3
India48.44555.6
Ireland69.84053.8
Italy73.04620.8
Kuwait73.73951.8
New Zealand74.24902.1
Nigeria71.14778.6
Oman49.33660.0
Pakistan48.04459.0
Philippines53.44238.6
Poland74.04305.0
Portugal67.65695.0
Qatar69.04910.8
Saudi Arabia70.74094.4
Singapore74.54788.7
South Africa66.84278.5
South Korea64.04321.3
Spain65.34454.6
Sweden68.04615.0
UAE66.45183.1
UK73.64783.2
USA72.44671.5
Vietnam71.94513.5


We also capture data on a per State basis, for our US customers. The list below represents those States where the volume of data makes for meaningful data sharing.

StateScore (%) Time (secs)
USA all72.44671.5
Arizona70.93581.7
Arkansas66.03185.0
California73.66101.1
Colorado66.03333.8
District of Columbia74.93995.6
Florida67.24197.8
Georgia70.36449.2
Hawaii77.56622.5
Illinois77.14888.4
Kansas77.33731.7
Maryland70.83986.0
Massachusetts62.04268.3
Michigan77.84113.8
Minnesota76.24648.2
Mississippi70.16366.9
Missouri74.05197.3
New Jersey76.03624.2
New York75.15617.6
North Carolina69.64462.7
Ohio72.65928.0
Oregon71.03861.7
Pennsylvania75.93387.8
South Carolina64.05235.8
Texas74.35242.4
Utah74.05515.1
Virginia75.04322.5
Washington68.04265.8


Revit Architecture Advanced

2015
Average Score: 57.1%
Average Time: 1 hr 24 mins

CountryScore (%) Time (secs)
Argentina57.25435.0
Australia61.15256.2
Canada 62.35404.8
China48.74998.0
Egypt50.36677.5
Hong Kong57.55700.8
India49.04497.7
Ireland52.23995.0
Italy48.44587.0
New Zealand64.54560.0
Nigeria61.24222.5
Philippines48.15904.3
Qatar61.84562.5
Saudi Arabia63.24332.5
Singapore57.44862.6
South Africa63.04034.3
Spain62.55280.0
UAE61.78002.5
UK60.74860.0
USA62.95706.2
Vietnam58.66426.7


StateScore (%) Time (secs)
USA all62.95706.2
California60.45739.9
District of Columbia67.07167.5
Florida59.56343.1
Georgia68.37535.8
Michigan61.55005.0
Minnesota61.44824.0
New York67.76050.0
North Carolina56.35516.3
Oregon62.65955.0
Pennsylvania65.06665.0
Texas56.16039.7
Virginia66.84505.8
Washington63.74433.3


Revit Architecture is the most popular KS test topic, across our global customers. The impact of BIM on the AEC industry is significant and Revit is the dominant design tool, in terms of overall market share and breadth of supply chain resources.

R
Viewing all 112 articles
Browse latest View live